
Concept: The P-Value (Hypothesis Testing)
Statistical Concept Definition:
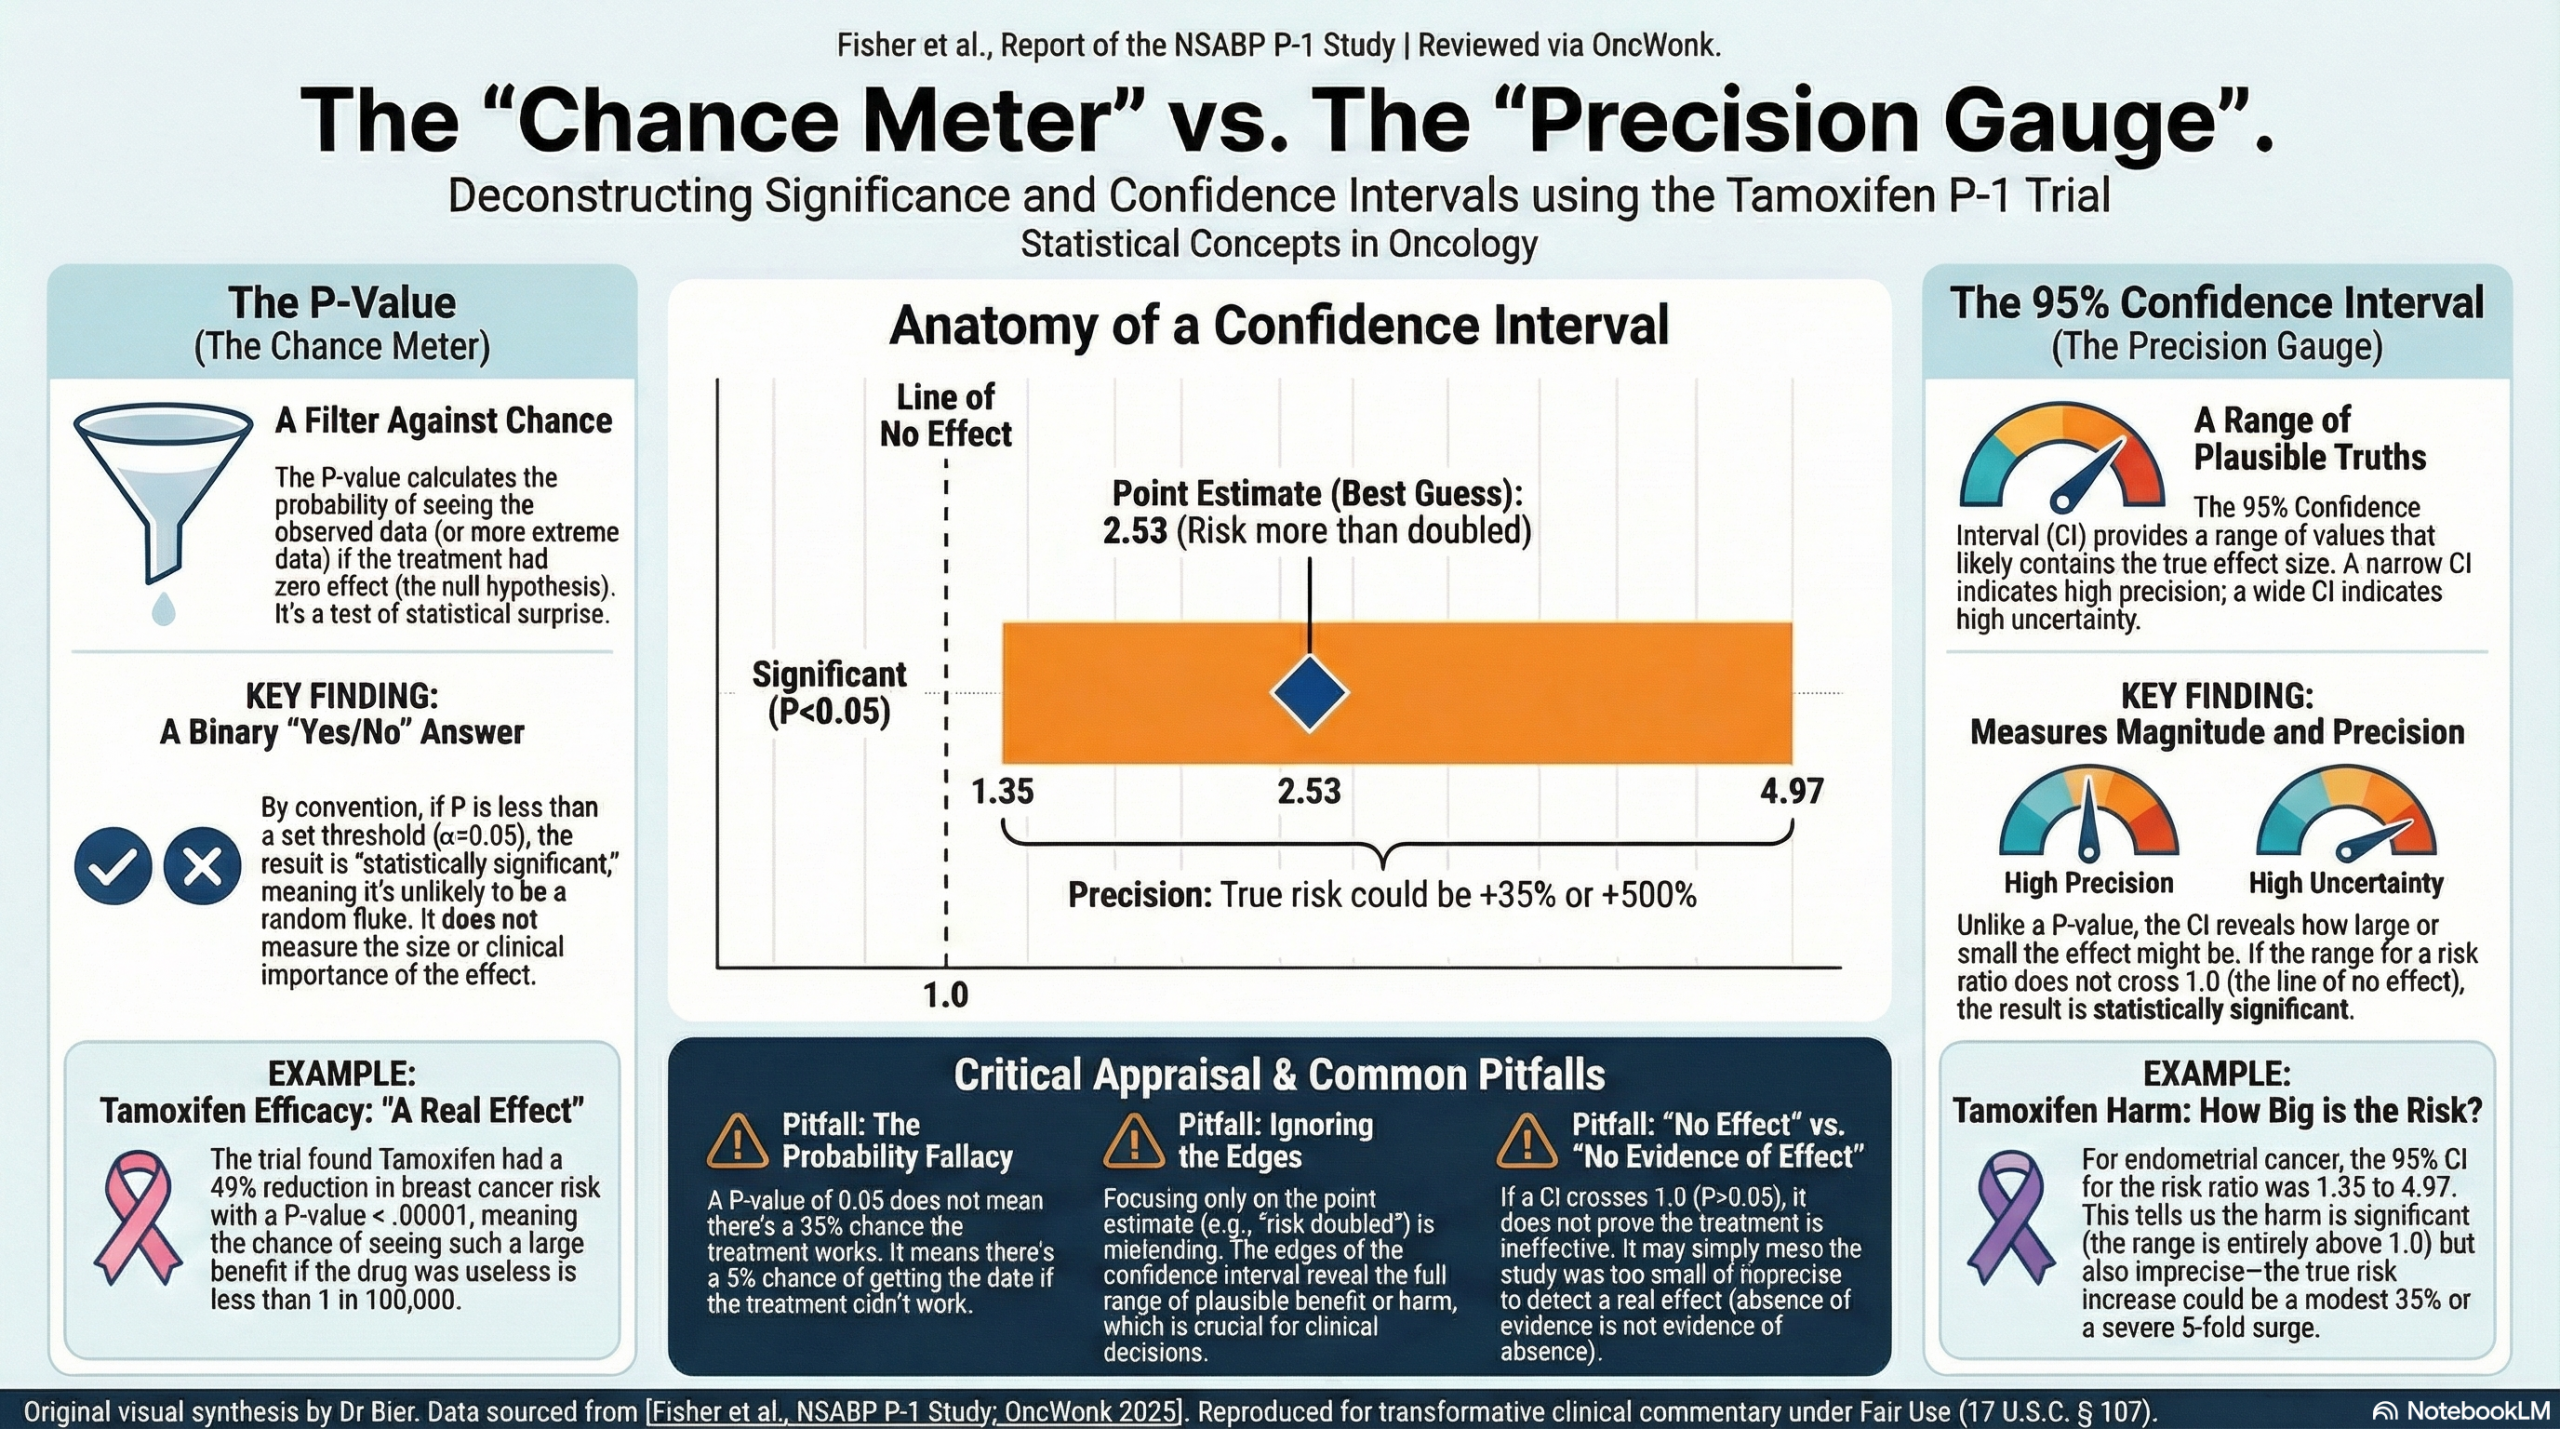
The P-value is the probability of obtaining a result at least as extreme as the one observed, assuming that the null hypothesis is true (i.e., assuming there is truly no difference between the groups). It quantifies the strength of the evidence against the null hypothesis.
Clinical Significance:
The P-value acts as a binary filter for decision-making. By convention, if the P-value is below a pre-specified threshold (usually α = 0.05), we reject the null hypothesis and declare the result “statistically significant”. This suggests that the observed difference is unlikely to be due to chance alone. However, a P-value tells us nothing about the magnitude of the effect or its clinical importance.
Critical Appraisal Guide:
- Verify the Threshold: Ensure the authors defined their significance level (usually P < 0.05) a priori.
- Assess the “Surprise”: Think of the P-value as a “Surprise Meter.” If a treatment has zero effect (Null Hypothesis is true), how surprised should we be by the data? A very low P-value (e.g., 0.001) means we would be extremely surprised to see such data if the drug didn’t work, leading us to conclude it probably does work.
- Check for Multiple Comparisons: Be wary if P-values are reported for dozens of secondary outcomes without statistical adjustment (like the Bonferroni correction), as this increases the risk of a false positive (Type I error).
Common Misinterpretations:
- Error: “A P-value of 0.05 means there is a 95% chance the treatment works.”
- Correction: The P-value refers to the data, not the hypothesis. It means there is a 5% chance of seeing this data if the treatment did not work.
- Error: “A non-significant P-value (e.g., P = 0.10) proves the treatments are equivalent.”
- Correction: Absence of evidence is not evidence of absence. It often simply indicates the study was underpowered to detect a difference.
Concept: Confidence Intervals (Estimation and Precision)
Statistical Concept Definition:
A 95% Confidence Interval (CI) is a range of values derived from the sample data that is likely to cover the true population parameter (e.g., the true risk ratio). If we were to repeat the study 100 times, 95 of the calculated intervals would contain the true effect size.
Clinical Significance:
Unlike the P-value, the CI provides the magnitude of the effect (how well does the treatment work?) and the precision of the estimate (how sure are we?).
- Width: A narrow CI implies high precision (usually from a large sample size). A wide CI implies low precision and high uncertainty.
- Location: If the 95% CI for a difference excludes 0 (or excludes 1 for a Ratio), the result is statistically significant at the 0.05 level.
Critical Appraisal Guide:
- The Line of No Effect: Visualize the result on a Forest Plot. Does the horizontal line (the CI) cross the vertical “line of no effect” (1.0 for Risk Ratios)? If it does, the result is not statistically significant.
- Clinical Relevance check: Look at the boundaries. If a study claims “no difference” but the CI extends to a range that includes a clinically massive benefit (or harm), the study is inconclusive, not negative.
Common Misinterpretations:
- Error: “There is a 95% chance the true value is within this specific interval.”
- Correction: Strictly speaking, the true value is fixed; it is the interval that varies from study to study. 95% of such intervals capture the truth.
- Error: Focusing only on the point estimate (the average) and ignoring the edges of the interval.
Literature Case Study: Tamoxifen for the Prevention of Breast Cancer
Source: Fisher B, et al. Tamoxifen for Prevention of Breast Cancer: Report of the National Surgical Adjuvant Breast and Bowel Project P-1 Study.
- Analysis of Efficacy (P-Value Focus)
- Finding: The study reports that Tamoxifen reduced the risk of invasive breast cancer by 49%.
- Metric: “Two-sided P < .00001”.
- Interpretation: This P-value is vanishingly small. If Tamoxifen were truly ineffective (no different from placebo), the probability of observing such a dramatic reduction in cancer rates by random chance is less than 1 in 100,000.
- Clinical Takeaway: We can confidently reject the null hypothesis. The reduction in breast cancer is real and statistically significant.
- Analysis of Harm (Confidence Interval Focus)
- Finding: The study observed an increase in endometrial cancer in the Tamoxifen group.
- Metric: “Risk Ratio = 2.53; 95% Confidence Interval 1.35-4.97”.
- Interpretation:
- Significance: The interval (1.35 to 4.97) does not cross 1.0. Therefore, the increased risk is statistically significant.
- Precision & Magnitude: The best estimate is that Tamoxifen increases risk 2.53 times. However, the CI tells us the “true” risk increase could plausibly be as low as 35% (1.35) or as high as nearly 500% (4.97).
- Clinical Takeaway: While the P-value (implied < 0.05) tells us the harm is “real,” the Confidence Interval warns us that the magnitude of this harm is somewhat uncertain (ranging from moderate to severe risk). A clinician must weigh this potential 5-fold risk increase against the cancer prevention benefit.
Fair Use & Copyright: This post provides a transformative, thesis‑driven critical appraisal intended for educational and scholarly purposes. It is not a reproduction of, nor a market substitute for, the original research article.
Support the Version of Record: To support the copyright holders and verify the underlying data—including primary survival curves, risk estimates, and other core outcomes—readers are strongly encouraged to access the original Version of Record via the link or DOI provided above.
Medical Disclaimer: This content is for informational and educational purposes only and is not a substitute for professional medical advice, diagnosis, or treatment.